Paradocx
By: John Vereen
Now
we are going to explore some parametric equations. Parametric equations are
equations defined by a pair of functions where the two continuous functions are
defined by the ordered pair (x,y).
Also, varying t values will affect how the function/curve appear on the graph.
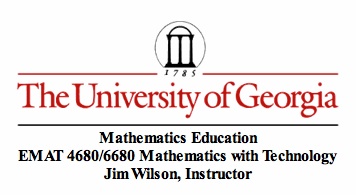
As we can see above, we have the unit circle, which is defined by the functions
x = cos(t)
and y – sin(t). This is a very basic example of a parametric equation.
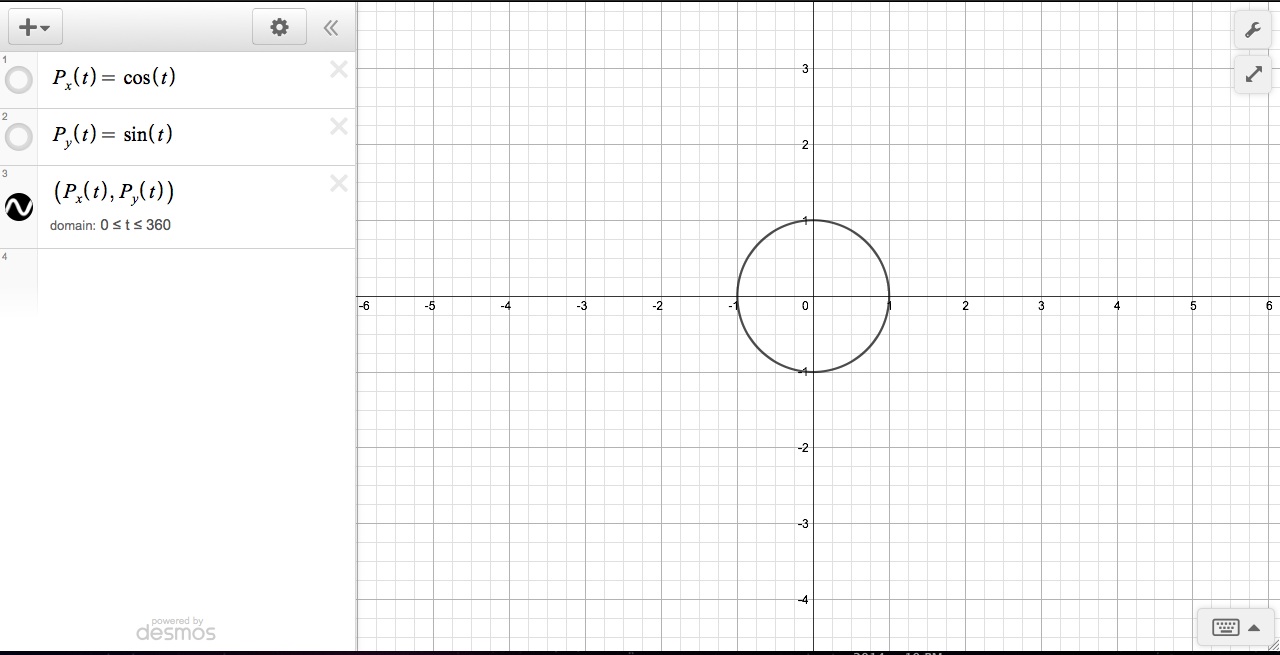
Now,
we will explore graphs of the form x = a(cos(t)) and y = b(sin(t)). Above, I have graphed the
parametric equation where a=4 and y=1. We see that we have created an ellipse
that extends out to the point (4,0) and up to the point (0,1). Thus, we have
created an ellipse that extends itself horizontally.
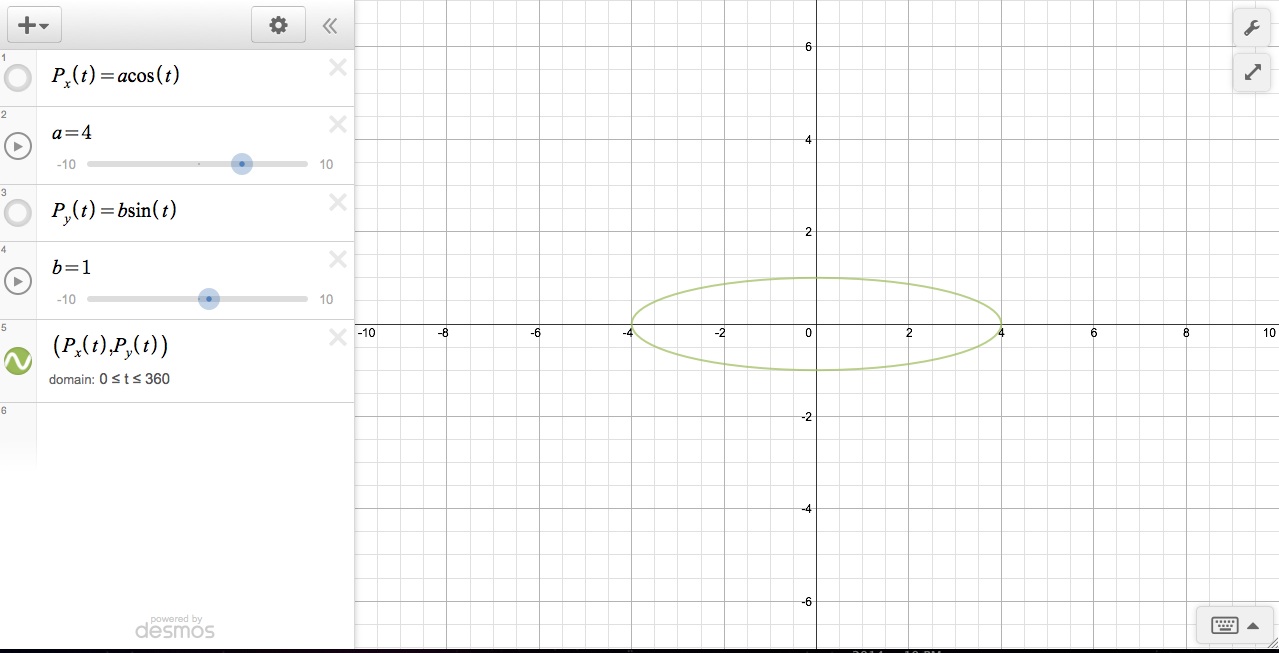
In
this graph, we have graphs of the same form; however, we have a = 3 and b = 5.
Some general observations that we can make comparing this graph to the previous
graph is that the ellipse is not quite as narrow. Also, this ellipse extends
itself out to the point (3,0) and up to the point (0,5). So, we have created an
ellipse that extends itself vertically.
We
can make a few generalization about graphs of the form x = a(cos(t)) and y = b(sin(t)) for various values for a and for b.
1)
When
a=b, then we have a circle with radius length a (or b).
2)
When
a > b, then we have an ellipse that extends horizontally.
3)
When
b > a, then we have an ellipse that extends vertically.
4)
The
larger the ratio of (a/b) or (b/a), the more narrow the ellipse.